Tracing RabbitMQ Messages August, 2014
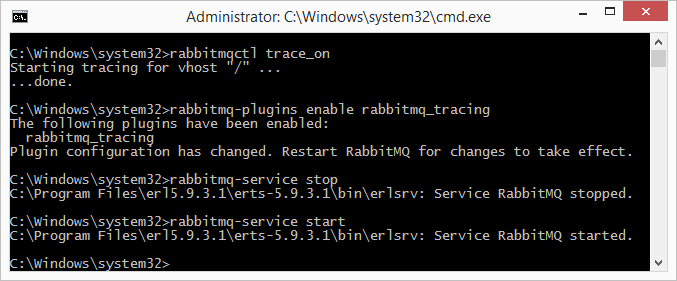
Sometimes it’s helpful to see what is being published and consumed on a RabbitMQ node. RabbitMQ ships with a feature called the Firehose Tracer that allows you to dump both incoming and outgoing messages into queues for examination. There is also a plugin that adds tracing to the management UI. The following steps to enable tracing are done on a Windows box but should be identical on linux:
Once tracing and the UI plugin are enabled you will see a “Tracing” tab under the “Admin” tab:
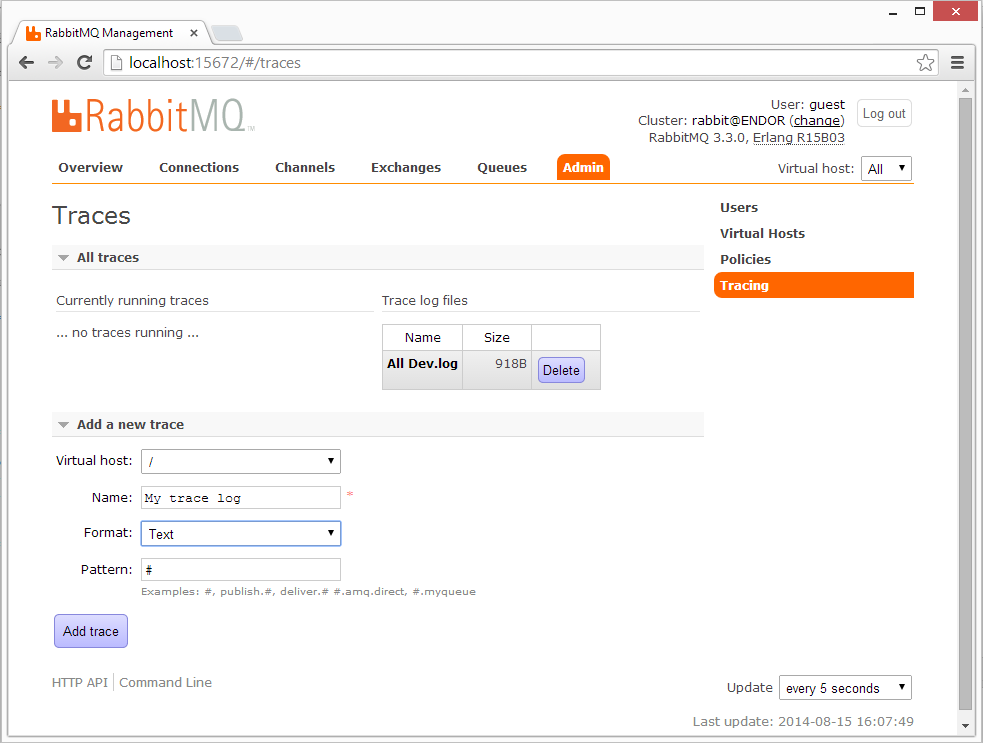
Here you can create a topic queue for trace messages. The pattern can be # to capture all messages or a topic in the form of publish.[exchange name] or deliver.[queue name] to trace messages published through a particular exchange or consumed from a particular queue. Clicking on the log name will bring up the log, shown here in Text format:
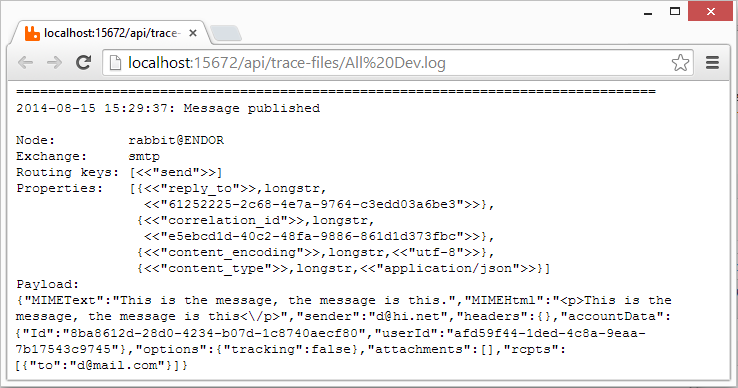
The physical log files are dropped under [system drive]\var\tmp\rabbitmq-tracing on Windows. And if you’re tracing on a production node, remember to turn it off when you are done: rabbitmqctl trace_off.
 Bender (51 )